1.3.5.9.  PARTapplicationServer Dashboard

Call up the PARTapplicationServer dashboard for AppServer administration.

PARTadmin -> AppServer Client [AppServer client] category -> Diagnostics [Diagnostic] dialog area -> Click on Show server status [Show server state]

[Note]Note

For this the service has to run, otherwise the command is inactive.

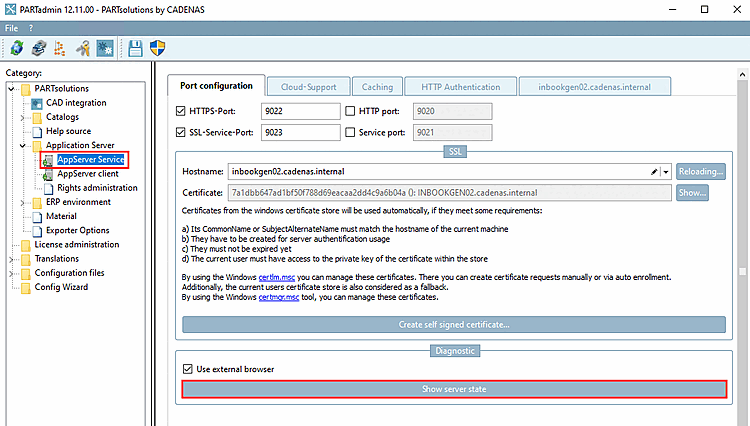
-> The PARTapplicationServer dashboard opens. (Directly after the first setup you can test whether the server is accessible)
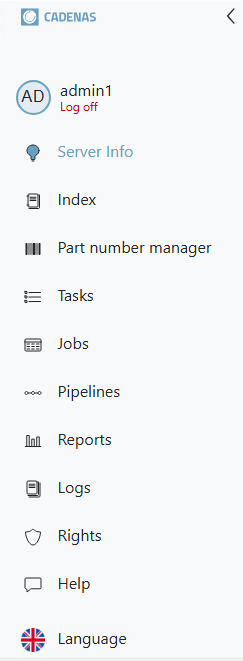
[Note]Note

For data protection reasons, certain access options are only available to the admin user. If there is no login or login is via another user, only the Services and Web modules Tabbed pages are visible under Server status. View logs is inactive.

The figure shows only the "Services " and "Web modules [Web-Modules] " tabs under "Server status [Server state] ".

The figure shows only the "Services " and "Web modules [Web-Modules] " tabs under "Server status [Server state] ".

Next to User (Login) on the far right you will see the following tabs:

  • Server info:

    • 3Dfindit

      • General

      • Users

      • Meetings

    • System resources

      • Memory

      • Disk

      • CPU

      • Threads

      • Caches

      • Long-term values

      • Long-term graph

        pappserver.cfg

        [ManagementModule]
        EnableInterceptor=true
        EnablePerfLogToDB=true
        

        Wenn Sie Auswertungen sehen möchten, die in der Vergangenheit liegen, müssen diese in der Datenbank abgelegt werden. Setzen Sie hierzu den Schlüssel EnablePerfLogToDB auf "true".

    • Server status

      • Services

      • Web modules

      • Users

      • Environment variables: All environment variables of the server are displayed, for example CADENAS_DATA or CADENAS_LICENSE.

      • System information: On the System information Tabbed page you will find subcategories for licenses, catalogs, network information, file system mounts and OpenGL information.

      • Service clients

      • Mini-Dumps: Minidumps of the PARTapplicationServer

  • Index:

    Index > Tabbed page "Catalogs"

    Index > Tabbed page "Catalogs"

    Index > Tabbed page "Classifications"

    Index > Tabbed page "Classifications"

    Actions:

    • Update all indexes

    • Update display indexes

    • Updating text indexes

    • Updating geo-indexes

    • Update LinkDB indexes

    • Uninstall

    • Show outdated catalogs/classifications

    • Cancel waiting

    Notifications: Shows the current and already completed activities

    Refresh: Click on the icon to update the respective index. If the checkbox at the beginning of the line is activated, all index types of the respective catalog or classification are updated.

    You can carry out new installations and updates of catalogs and classifications in PARTadmin under Category PARTsolutions > Catalogs > Update > Online. See Section 1.3.3.1, “ Catalog update Online ”.

  • Tasks:

    You can find details on this under Section 1.4.3, “ PARTapplicationServer Dashboard - Tasks ” in PARTwarehouse Manual

  • Jobs:

  • Pipelies:

  • Reports:

  • Logs:

  • Rights:

    The displayed contents correspond to those under PARTadmin > Category PARTsolutions > Application Server > Rights management [Rights administration] > Tabbed page Rights [Assign rights] assignment. See also under Section 1.3.5.8.1.3, “Tabbed page "Rights assignment" ”"Rights Section 1.3.5.8.1.3, “Tabbed page "Rights assignment" ”.

  • Help: Select the desired version.

    • Empty: Version installed in the "proghelp" directory of the server

    • Latest: Online updates are made after the release of a version. You can get them here.

    • Correspondingly named older versions

[Note]Note

If needed, have a look on server processes.

Each accessing client creates a process on the PARTapplicationServer.