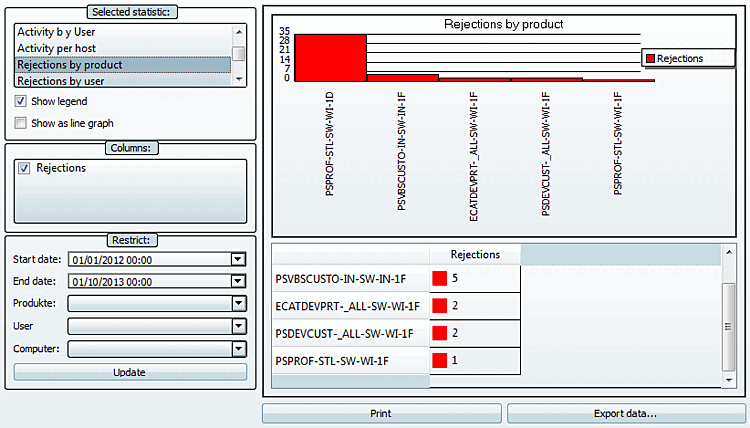
Various methods for statistical evaluations are available on the Statistics [Statistic] tab page.
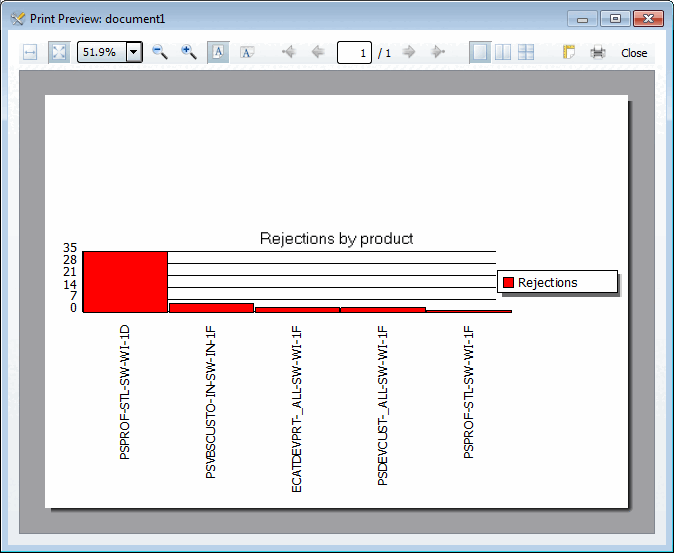
![Example: Rejections per product [Rejections by product]](https://webapi.partcommunity.com/service/help/latest/pages/en/3dfindit/doc/resources/img/img_2465ca258b6a4acd8e93ae34dbc0aeb5.png)
![[Note]](https://webapi.partcommunity.com/service/help/latest/pages/en/3dfindit/doc/images/note.png)
The single dialog areas and buttons
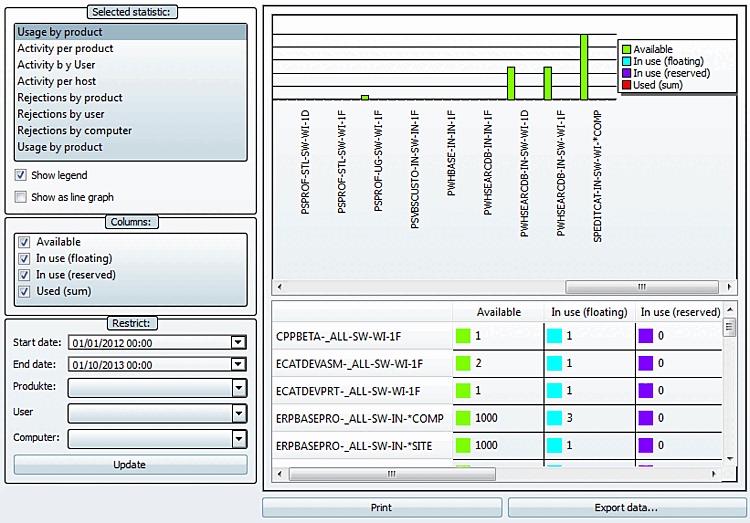
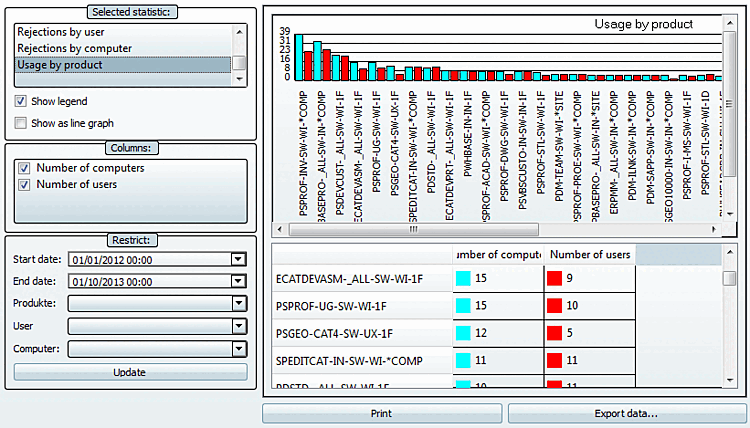
The Occupancy by product [Usage by product] statistic shows the maximum available floating licenses and the maximum number of occupancies in the set period for all available products listed individually. If the number of floating [In use (floating)] licenses is very close to the number of available licenses, an increase in capacity should be considered, even if no rejections have yet occurred. See also the statistics types Rejections per product [Rejections by product], Rejections per user [Rejections by user] and Rejections per computer [Rejections by computer].
This type of statistic is especially suitable for analyses over a longer period (month, year).


Occupied (floating) [In use (floating)]:
The highest value that has ever occurred in the set period is shown under Occupied (floating) [In use (floating)].

Occupied (reserved) [In use (reserved)]:
Reserved licenses are a subset of floating [In use (floating)] licenses.
The Borrow [Checkouts] tab page is used to administratively determine whether users are allowed to check out/borrow floating licenses. Detailed information on this can be found at Section 1.5.4.6, “Tabbed page "Borrowing" ”.
The loan is made in the respective module under ? -menu -> Licenses (F9) -> Checkout tab page. See Section 6.5.1.5, “ Checkout " tab page”" tab page.
This reduces the number of floating licenses available for the predetermined loan period.
A floating license can be "reserved" for a certain period of time, e.g. on a trip.

Occupied (total) [Used (sum)]: Corresponds to Occupied (floating) [In use (floating)]. This statistic type is especially suitable for shorter periods of time, let's say 7:00 to 12:00 of a certain day. You can recognize the level of fluctuation, in relation to a certain product. High fluctuation confirms, that your decision for Floating licenses is correct.
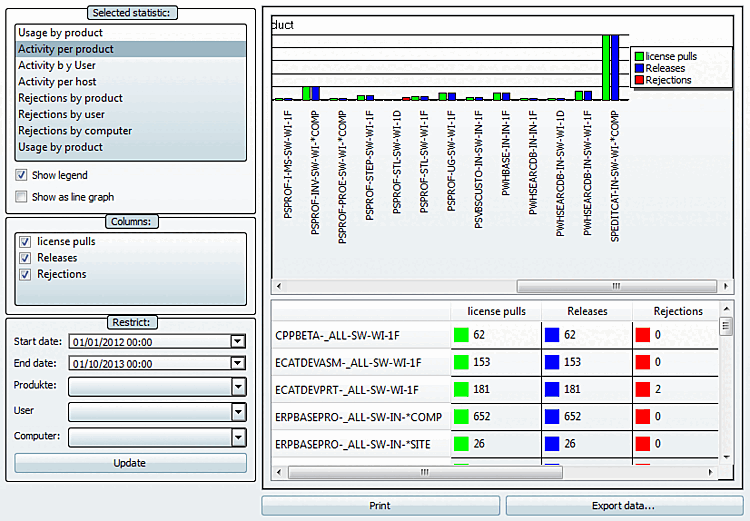
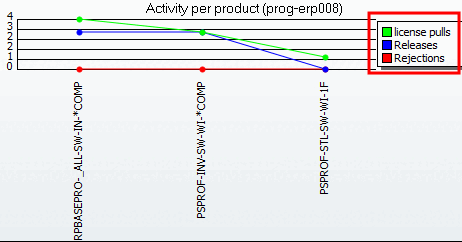
Occupancy [License pulls] and releases [Shares] count events in a specific period. If the analysis period is chosen unfavourably (e.g. 8:00 am to 12:00 noon), although work starts at 7:00 am (this is when the licenses are occupied), the releases may be higher than the occupancies.


Rejections can only occur, when there is no license available anymore at the moment of request.
If there are rejections, then the amount of Floating licenses should be increased.
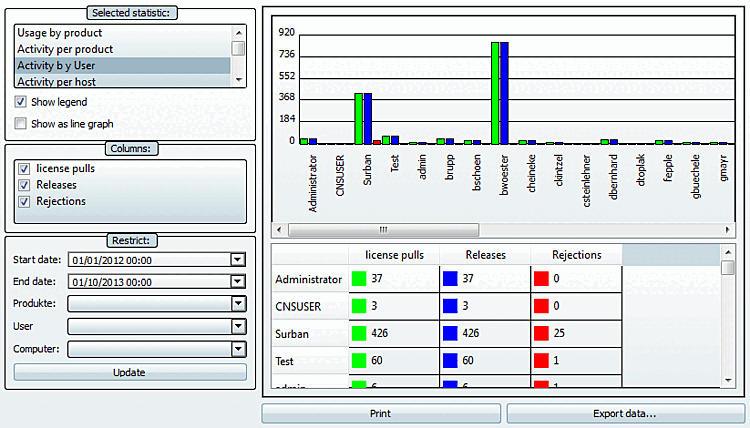
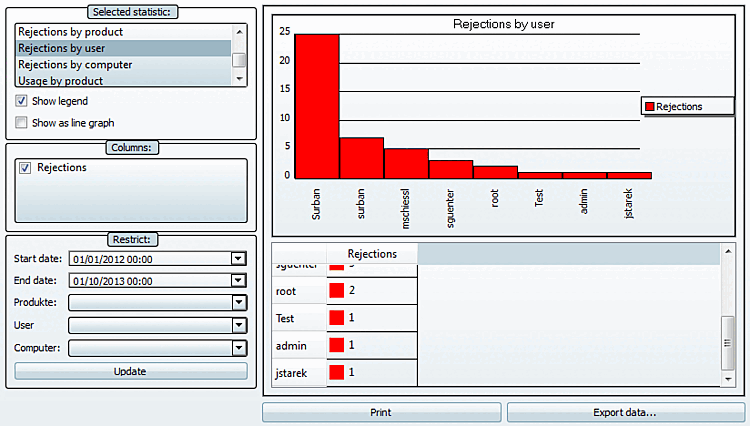
Analysis of user behavior. Many rejections? High fluctuation at license pulls and releases?
Rejections can only occur, when there is no license available anymore at the moment of request.
If there are rejections, then the amount of Floating licenses should be increased.
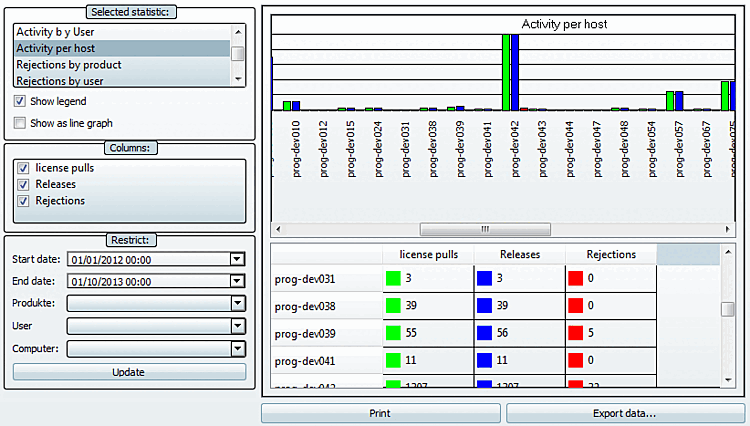
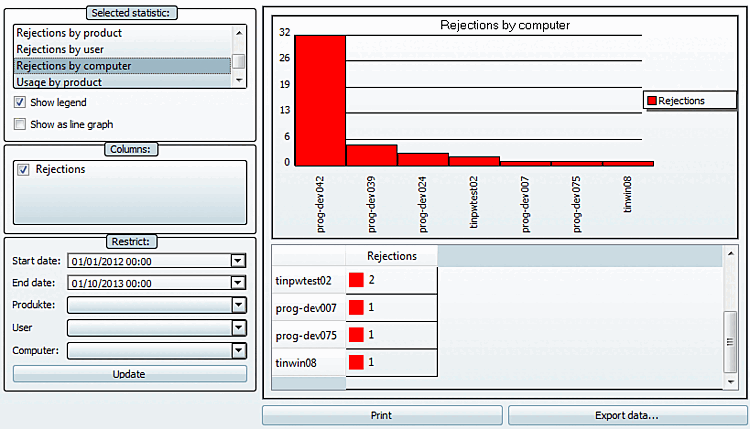
Similar analysis objective as with "Activity per user". Interesting when there are users with variable workplaces.
Rejections can only occur, when there is no license available anymore at the moment of request.
If there are rejections, then the amount of Floating licenses should be increased.
-
Rejections can only occur, when there is no license available anymore at the moment of request.
Rejections show that the amount of Floating licenses should be increased.
-
Rejections can only occur, when there is no license available anymore at the moment of request.
Rejections show that the amount of Floating licenses should be increased.
-
Rejections can only occur, when there is no license available anymore at the moment of request.
Rejections show that the amount of Floating licenses should be increased.
How many different users and/or computers use which product?
Is the number of computers higher than the number of users? This would show that there are users with variable workplaces.
An additional legend is displayed (also in print).
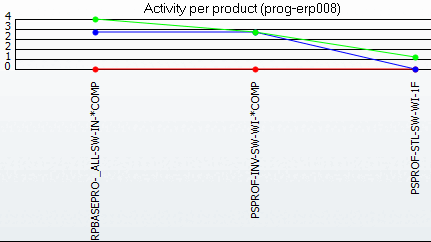
Display as a line chart [Show as line graph]:
The depiction is changed from bar graph to line graph.
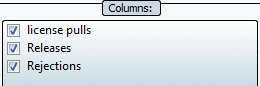
Depending on the chosen statistic the respective columns are displayed.
Hide not needed columns by clearing the checkbox.
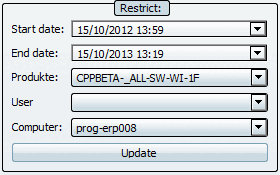
Here you can filter by: Start date, End date, Products [Parts], Users [User], Calculator [Computer]
Use the list box to select the desired values. For products [Parts], users [User] and computers [Computer], you can select any number of values using the checkboxes.
Right beside the setting options diagram and table view are displayed.
Print the result of the statistic evaluation.
Export the data of statistic evaluation in a CSV file. In this way you can process the data in other programs.
"Product","Rejections"
"PSVBSCUSTO-IN-SW-IN-1F",18
"PSDEVCUST-_ALL-SW-WI-1F",3
"PSPROF-STL-SW-WI-1D",3
"PDSTD-_ALL-SW-WI-1F",2
"ECATDEVPRT-_ALL-SW-WI-1F",1
"PSGEO-CAT4-SW-UX-1D",1