
Example for the visualization of workflows: Part applied? Released by whom?
|
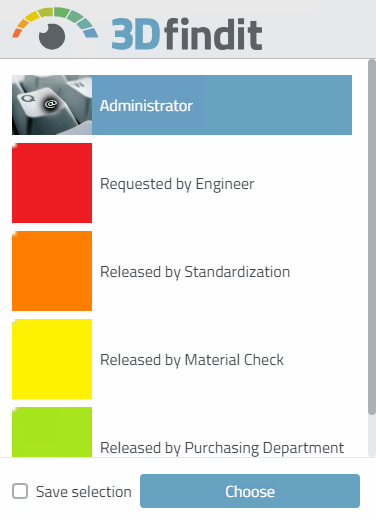
With the user selection "release ", there are 4 roles (and corresponding columns) for marking processes: |
|
((ERP_PDM_NUMBER.NE.'').AND.(WORKFLOW_USER.EQ.'xxxxx').AND.(WORKFLOW_STD.EQ.'xxxxx').AND.(WORKFLOW_MATQA.EQ.'xxxxx')
All 4 columns can contain the marking 'xxxxx'.
Display tab page -> Status bitmaps for table [Status indicating bitmaps for table view]:
The traffic light colors are controlled according to the following logic:
Yellow: Column for engineer, standardization and material testing contain the identifier 'xxxxx'
(WORKFLOW_USER.EQ.'xxxxx').AND.(WORKFLOW_STD.EQ.'xxxxx').AND.
(WORKFLOW_MATQA.EQ.'xxxxx').AND.(WORKFLOW_PD.NE.'xxxxx')Orange: Column for engineer and standardization contain the identifier 'xxxxx'
Red: Requested by an engineer, but not yet approved. Only his column contains the identifier 'xxxxx'.
![Display tab page -> Status bitmaps for table [Status indicating bitmaps for table view]:](https://webapi.partcommunity.com/service/help/latest/pages/en/installation/doc/resources/img/img_0ea8da893d5a4898bd08814b42aea79e.png)
![User: release - Role: Released by standardization [Released by Standardization]](https://webapi.partcommunity.com/service/help/latest/pages/en/installation/doc/resources/img/img_b3c4b9cea5704298b38c7ee0d6bc34a1.png)